How did the super-smart help economies grow? Other analyses by Ms Squicciarini and Mr Voigtländer suggest an answer: “upper-tail knowledge raised productivity in innovative industrial technology”. In other words, when the Industrial Revolution came along, the “Encyclopédiens” were the ones who could convert the technological improvements into industrial ones. The companies they helped build needed ever-smarter workers, but it was high super-smart density, not high average worker skill, that provided the initial economic magic.
|
FT
How did the super-smart help economies grow? Other analyses by Ms Squicciarini and Mr Voigtländer suggest an answer: “upper-tail knowledge raised productivity in innovative industrial technology”. In other words, when the Industrial Revolution came along, the “Encyclopédiens” were the ones who could convert the technological improvements into industrial ones. The companies they helped build needed ever-smarter workers, but it was high super-smart density, not high average worker skill, that provided the initial economic magic.
0 Comments
The Upshot (NY TIMES)
Next week, when Federal Reserve officials meet to decide whether to raise interest rates for the first time in nine years, one question will be front and center: How much faith should be placed in a line on a graph first drawn by a New Zealand economist nearly six decades ago, based on data on wages and employment in Britain dating to the 1860s? That would be the Phillips curve, one of the most important concepts in macroeconomics. It shows how inflation changes when unemployment changes and vice versa. The intuition is simple: When joblessness is low, employers have to pay ever higher wages to attract workers, which feeds through into higher prices more broadly. And inflation is particularly prone to rise when the unemployment rate falls below the “natural rate” at which pretty much everybody who wants a job either has one or can find one quickly. As the Fed’s chairwoman, Janet L. Yellen, put it in a 2007 speech, the Phillips curve “is a core component of every realistic macroeconomic model.” Except it doesn’t work. Or at least, it hasn’t worked very well in the last few decades in the United States. And it has proved particularly problematic to try to use that historical relationship to predict where inflation is going. That is why a longstanding academic debate is now at the core of the Fed’s policy debate. Ms. Yellen and many of her Fed colleagues have indicated that they think they should raise interest rates this year, in part because the Phillips curve suggests there will be excessive inflation if they don’t. The unemployment rate was 5.1 percent in September, just a smidgen above the 4.9 percent that Fed leaders believe is the appropriate jobless rate in the longer run. In other words, if you believe in the traditional Phillips curve, inflation should be taking off any day now. But this month, two Fed governors, Lael Brainard and Daniel K. Tarullo, argued against a rate move. Ms. Brainard said that the Phillips curve relationship was “at best, very weak at the moment.” Mr. Tarullo said that it was “probably wise not to be counting so much on past correlations, things like the Phillips curve, which haven’t been working effectively for 10 years now.” It’s only a slight exaggeration to say that the Fed’s rate decision this year will be based on whether its leaders really believe that the Phillips curve is useful in describing how the economy works in 2015. Wage inflation is on the rise view: From Brad DeLong Must-Watch: Really, really bad news for the American economy. Alan Krueger concludes that we are now near "full employment" in a monetary policy-Federal Reserve-inflation sense. The implications? The implications are:
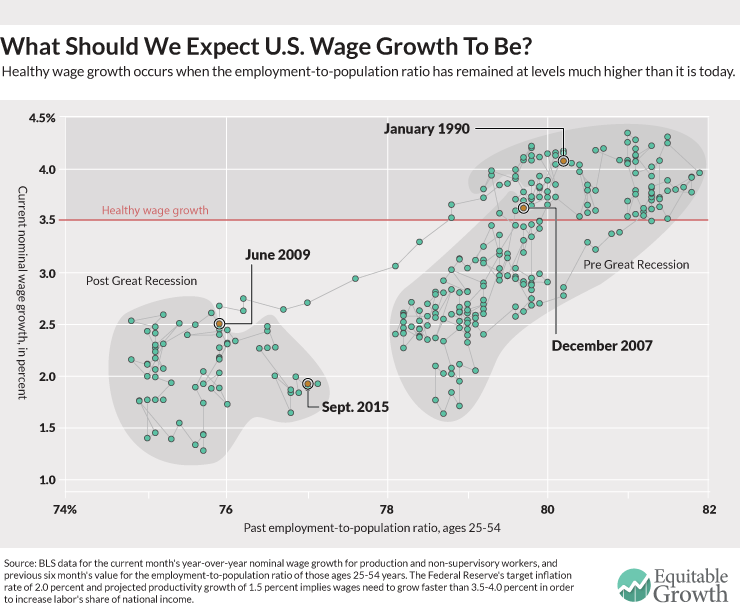
Alternative view (Ironically from WCSG and Matt Phillips) To understand the changes in the overall inflation Phillips curve, it might be useful to look at another version of the curve: the relationship between unemployment and “wage inflation,” better known as wage growth. Now, that curve doesn’t look that great either, but that might be because the unemployment rate is currently overstating the health of the labor market. If we take a look at the relationship between wage growth and another measure of labor market slack, however, the relationship might hold up. The graph shows the relationship between wage growth for production and non-supervisory workers, and the employment rate for prime-age workers six months prior. It clearly shows that when the labor market is tighter (when the employment rate is higher), wage growth is stronger. Econlog
Economists have long debated whether rules or discretion should govern monetary policy. But after inflation declined in the 1980s, the debate partly subsided as many began to favor what are called "feedback rules." With strict rules seen as too rigid and unconstrained discretion as too flexible, feedback rules allegedly provided the best of both worlds. And the premier feedback rule is the Taylor Rule. Indeed, many critics of the Federal Reserve, believing that it had exercised far too much discretion either prior to or in response to the financial crisis of 2007-2008, conclude that it should have adhered more closely to the Taylor Rule. Some have now gone so far as to propose legally binding the Fed to this kind of feedback rule. Yet a closer look at the Taylor Rule reveals that it is fundamentally flawed and could well make monetary policy worse. This is the opening paragraph of "What's Wrong with the Taylor Rule?" by San Jose State University economics professor Jeffrey Rogers Hummel. It's one of the two Featured Articles for November's Econlib.Here's one of my favorite paragraphs: Although economists disagree about the magnitude, extent, and duration of the liquidity effect, the bottom line is that the initial impact of monetary policy on interest rates is self-reversing. Therefore, depending on inflationary expectations, low nominal interest rates can be a sign of either tight or easy money. This dilemma bedeviled monetary policy until the work of Milton Friedman and the Great Inflation of the 1970s brought widespread acceptance of the Fisher effect. Indeed, it was not until the Taylor Rule that central banks had an explicit model for adjusting their interest-rate target for this effect. That this rule took so long to develop should be a source of both embarrassment and epistemic humility for economic policy makers. And here's what I regard as the most important paragraph of Jeff's critique: But the deeper, more critical flaw in Taylor Rules is that the long-run, equilibrium real rate of interest--or what is alternatively called the natural or neutral rate--is also unobservable. Yet these rules make the astonishing assumption that their estimates are not only correct but also relatively fixed and unchanging over extended periods. In short, Taylor Rules virtually preclude any factor, other than central banks, from affecting the equilibrium real rate of interest. A standard rationale for this assumption is what is known as the Ramsay-Cass-Koopmans model. This model estimates the natural interest rate for a closed economy with a fixed number of infinitely-lived households, all identical. Each household has the same rate of time preference, the same declining marginal utility of consumption, and the same rate of population growth. This almost rules out any fluctuations in the natural rate that might arise from alterations in how individuals discount the future, from how consumption preferences may differ among individuals or alter over time for one individual, or from differences in the distribution of wealth. Why "History of Economic Thought" should be added (back) to undergraduate economics ciriculum8/18/2015 Bloomberg
Bakken oil production in North Dakota has fallen less than 2 percent from its peak in December, while the number of oil rigs in the state has fallen by 60 percent. EOG Resources Inc., the largest shale driller, says it can make a 30 percent after-tax return on $50 oil in its best plays. Whiting Petroleum Corp., the largest Bakken producer, said it’s preparing to be able to grow production at $40 to $50 prices. “A single break-even price doesn’t actually exist,” Foiles said in a presentation. “Rather, what the model indicates is that at a realized oil price of $29.42, half of wells will generate returns exceeding 10%. This price is considerably lower than the $70 breakeven estimated by industry watchers at the start of the oil price slump.” David Stockman (hat tip Michael Lim)
The Telegraph
If the oil futures market is correct, Saudi Arabia will start running into trouble within two years. It will be in existential crisis by the end of the decade. The contract price of US crude oil for delivery in December 2020 is currently $62.05, implying a drastic change in the economic landscape for the Middle East and the petro-rentier states. The Saudis took a huge gamble last November when they stopped supporting prices and opted instead to flood the market and drive out rivals, boosting their own output to 10.6m barrels a day (b/d) into the teeth of the downturn. Bank of America says OPEC is now "effectively dissolved". The cartel might as well shut down its offices in Vienna to save money. The problem for the Saudis is that US shale frackers are not high-cost. They are mostly mid-cost, and as I reported from the CERAWeek energy forum in Houston, experts at IHS think shale companies may be able to shave those costs by 45pc this year - and not only by switching tactically to high-yielding wells. Advanced pad drilling techniques allow frackers to launch five or ten wells in different directions from the same site. Smart drill-bits with computer chips can seek out cracks in the rock. New dissolvable plugs promise to save $300,000 a well. "We've driven down drilling costs by 50pc, and we can see another 30pc ahead," said John Hess, head of the Hess Corporation. It was the same story from Scott Sheffield, head of Pioneer Natural Resources. "We have just drilled an 18,000 ft well in 16 days in the Permian Basin. Last year it took 30 days," he said. He said the resilience of the sister industry of shale gas should be a cautionary warning to those reading too much into the rig-count. Gas prices have collapsed from $8 to $2.78 since 2009, and the number of gas rigs has dropped 1,200 to 209. Yet output has risen by 30pc over that period. Until now, shale drillers have been cushioned by hedging contracts. The stress test will come over coming months as these expire. But even if scores of over-leveraged wild-catters go bankrupt as funding dries up, it will not do OPEC any good. The wells will still be there. The technology and infrastructure will still there. Stronger companies will mop up on the cheap, taking over the operations. Once oil climbs back to $60 or even $55 - since the threshold keeps falling - they will crank up production almost instantly. Mr Sheffield said the Permian Basin in Texas could alone produce 5-6m b/d in the long-term, more than Saudi Arabia's giant Ghawar field, the biggest in the world. Saudi Arabia is effectively beached. It relies on oil for 90pc of its budget revenues. There is no other industry to speak of, a full fifty years after the oil bonanza began. In hindsight, it was a strategic error to hold prices so high, for so long, allowing shale frackers - and the solar industry - to come of age. The genie cannot be put back in the bottle. Once again
The Telegraph AEP With hindsight it is clear that the world economy came within a whisker of recession earlier this year. Global shipping volumes contracted by 3.4pc between January and May, according to Holland’s CPB world trade index. This episode is now behind us. Leading indicators and monetary data in the US, Europe and China point to an accelerating rebound over coming months. Gabriel Stein, from Oxford Economics, says the growth rate of the world's real M3 money supply – based on the US, China, EMU, the UK, Japan and Canada – rose to a six-year high of 6.2pc in June. The M3 gauge tends to lead economic growth by 12 months or so, suggesting that the worst may soon be over. In Europe, the monetary kindling wood of recovery is clearly catching fire.Spain is growing at its fastest pace since the post-Lehman crisis. So is Ireland. The triple effects of quantitative easing by the European Central Bank, a 12pc fall in the trade-weighted index of the euro in 15 months and the fall in Brent crude prices from $110 to $50, have together lifted Euroland out of its six-year depression. The property slump is over. Standard & Poor’s expects house prices to rise 3pc in Holland, 4pc in Portugal, 5pc in Germany and 9pc in Ireland this year. keep going with QE until the end of next year,” he said. America is slowly weathering the effects of the strong dollar. The economy grew at a 2.3pc rate in the second quarter. Capital Economics expects it to accelerate to 3pc in the second half. Loans are growing at an 8pc rate. It is not a glorious boom, but nor is it the stuff of global meltdowns. The commodity crash may feel as if Armageddon has arrived but it is, in reality, the tail-end of China’s hard landing, compounded by Saudi Arabia’s political decision to flood the global crude market and strike a blow against Russia, Iran and the US shale industry. “There has been a sharp drop in the ‘commodity-intensity’ of China’s economic growth,” said George Magnus, a trade expert and a senior adviser to UBS. “This has sent very chilly winds through parts of the world. Vast swathes of the emerging market universe have lost their export prop." The synchronized rout that we have seen across the gamut of commodities – from copper, to thermal coal, soya and milk - is certainly hair-raising. The Reuters-Jeffrey CRB index of raw materials has collapsed by almost 60pc from its peak in 2008 and is back to levels first reached in 1971. There is a risk that this could go too far and metastasize, leading to a second leg of global deflation. This would play havoc with debt dynamics in a world where debt ratios have risen by 30 percentage points of GDP since 2008, reaching unprecedented levels. Yet commodity crashes are double-edged. They act as a stimulus for the world economy. The consuming nations are enjoying a $500bn "tax cut" from the OPEC cartel. The slide may soon touch bottom in any case, if it has not already done so. The Baltic Dry Index measuring freight rates for dry commodities has almost doubled since the start of June. The shipping firm Clarksons said it is being driven by a revival of Chinese steel demand. The chances are that the growth scare of 2015 will prove to be a false alarm, much like the nasty episodes of 1987 and 1998 when market tantrums – frightening at the time – turned out to be innocuous. The cycle had another two years’ life both times. Markets over-reacted violently this week to a fall in China’s PMI manufacturing gauge to 47.8 in July, fearing that the economy is now in the grip of such powerful debt-deleveraging that stimulus no longer works. But the survey was distorted by the immediate fallout from the stock market debacle in Shanghai. Nomura says its "growth surprise index" is signalling a “strong rebound” after touching the bottom in May. |
Categories
All
Archives
November 2017
|


 RSS Feed
