The current market expectations around the US economy are much too positive. I alluded to this in a post over a month ago.
I have discussed the dismal state of Wall Street, IMF and FED forecasting on several occasions in these pages. These analysts: act as a herd, over rely on models, do not know how to think about systems, focus on the wrong data, and, as Hussman points out, exhibit binary thinking.
From Hussman:
More broadly, the real question is how much importance should we put on the fact that economic data has delivered consistent "positive surprises" in recent weeks? Don't all these surprises significantly short-circuit the risk of probable recession?
On that question, the evidence is very clear. No, they do not.
In order to properly understand economic "surprises," it's important to recognize that unlike actual economic data, where fluctuations have to do with, well, the actual economy, economic surprises are - by definition - measured relative to the subjective expectations of economists and Wall Street analysts. Unfortunately, analysts tend to be all-or-none. Instead of allowing for a normal ebb-and-flow of data, they form expectations that overshoot both on the pessimistic side and on the optimistic side. As a result, once the economy experiences an initial softening, expectations turn lower, often very aggressively. Over the following weeks, economic data can continue to be fairly soft, but because expectations have collapsed, the new data is interpreted as being "above expectations." After a while, that experience of positive surprises causes analysts to over-correct by forming overly optimistic expectations, which is predictably followed by a period where the data, unless it is spectacular,
almost cannot help but disappoint.
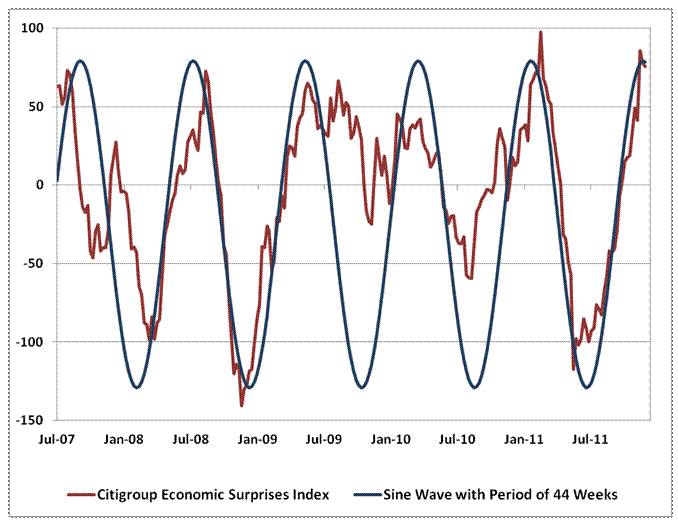
My observation is that this cycle of optimism and pessimism tends to run just over 20 weeks in each direction, though that is certainly not a magic number of any kind, and is best interpreted as a tendency. To give you an idea of how this regular pendulum of hope and despair affects the data in practice, the chart below presents the Citigroup Economic Surprises Index (a tally of how often recent economic reports have either beat or fallen short of consensus expectations). The blue line, to the thrill of anyone who enjoys Trigonometry, is a sine wave with a period of 44 weeks. “ (See Chart at end of post)
So how would I do it better? Start by asking questions if your data or models or answers actually make sense given the broader context of what is happening. Start by asking yourself how bad things are going to get in Europe.
Europe is going to have a strong recession. What’s more they are practicing austerity and have structural issues that prevent their economies from readjusting to sustainable growth path. I have heard remarked on business television that 40% of US corporate earnings are tied to Europe. At home, the states have a budget crisis and, at this writing, congress is struggling to pass a bill that extends the payroll tax holiday for only 60 days. Not to mention the US has its own structural employment issues.
IMO, the only way the US can avoid a recession is if a stimulus package is passed. What are the odds of that? How big will it be, when will it get implemented?
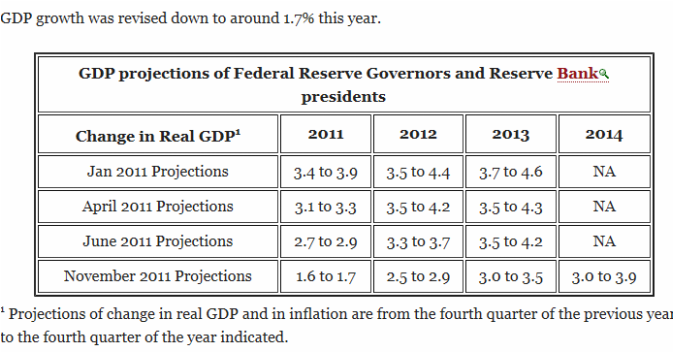
The problem in forecasting is not when you expect growth to be 3.7% and it turns out to be 3.3%. The problem occurs when growth is 1.7%. Just look at the embarrassing forecasts put out by the FED this year that typify the stupidity of mainstream analysis.(See second graph at end of post)
As my Econometrics professor was apt to say: “Monkeys can run regressions.”
Thinking about and understanding the context of data that is another matter entirely. This is a rarity in the professional economist
community.


 RSS Feed
